 |
|||||||||||||
|
|
|||||||||||||
|
This is the next round of work on the World Hunger project, continuing World Hunger 2/6/2012.
Contents
The Future Work imagined before class on 2/6/2012 was outlined as follows:
Here is the map from before, showing Central and South American countries with undernourishment rates above 5%.
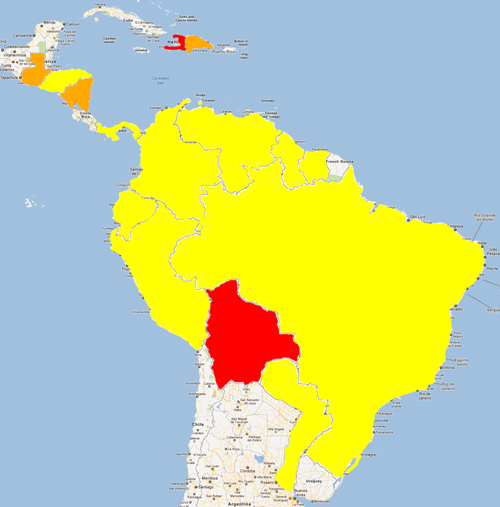 |
Hunger in Central and South America
The countries colored in RED have High undernourishment (25-34%).
The countries colored in ORANGE have Moderately High undernourishment (15-24%).
The countries colored in YELLOW have Moderately Low undernourishment (5-14%).
The countries not colored have undernourishment below 5%. |
We gathered a current summary of the disputes in each country from The World Factbook from the website of the Central Intelligence Agency.
Here is the list of countries with population and hunger status from before, with the new data added.
| Country | Population | GDP Per Capita | Population Below Poverty Line ($2/day) |
Disputes |
| Bolivia | 10,426,154 | $4,800 (2011 est.) |
30.3% | Chile and Peru rebuff Bolivia's reactivated claim to restore the Atacama corridor, ceded to Chile in 1884, but Chile offers instead unrestricted but not sovereign maritime access through Chile for Bolivian natural gas; contraband smuggling, human trafficking, and illegal narcotic trafficking are problems in the porous areas of the border with Argentina. |
| Haiti | 10,085,214 | $1,200 (2011 est.) |
80% (2003 est.) |
Since 2004, about 8,000 peacekeepers from the UN Stabilization Mission in Haiti (MINUSTAH) maintain civil order in Haiti; despite efforts to control illegal migration, Haitians cross into the Dominican Republic and sail to neighboring countries; Haiti claims US-administered Navassa Island. |
| Dominican Republic | 9,378,818 | $9,300 (2011 est.) |
42.2% (2004) |
Haitian migrants cross the porous border into the Dominican Republic to find work; illegal migrants from the Dominican Republic cross the Mona Passage each year to Puerto Rico to find better work. |
| Guatemala | 14,713,763 | $5,000 (2011 est.) |
51% (2006 est.) |
Annual ministerial meetings under the OAS-initiated Agreement on the Framework for Negotiations and Confidence Building Measures continue to address Guatemalan land and maritime claims in Belize and the Caribbean Sea; Guatemala persists in its territorial claim to half of Belize, but agrees to Line of Adjacency to keep Guatemalan squatters out of Belize's forested interior; Mexico must deal with thousands of impoverished Guatemalans and other Central Americans who cross the porous border looking for work in Mexico and the United States. |
| Nicaragua | 5,815,524 | $3,200 (2011 est.) |
48% (2005) |
Memorials and countermemorials were filed by the parties in Nicaragua's 1999 and 2001 proceedings against Honduras and Colombia at the ICJ over the maritime boundary and territorial claims in the western Caribbean Sea, final public hearings are scheduled for 2007; the 1992 ICJ ruling for El Salvador and Honduras advised a tripartite resolution to establish a maritime boundary in the Gulf of Fonseca, which considers Honduran access to the Pacific; legal dispute over navigational rights of San Juan River on border with Costa Rica. |
| Brazil | 192,376,496 | $11,600 (2011 est.) |
26% (2008) |
Uncontested boundary dispute between Brazil and Uruguay over Braziliera/Brasiliera Island in the Quarai/Cuareim River leaves the tripoint with Argentina in question; smuggling of firearms and narcotics continues to be an issue along the Uruguay-Brazil border; Colombian-organized illegal narcotics and paramilitary activities penetrate Brazil's border region with Venezuela. |
| Colombia | 46,368,000 | $10,100 (2011 est.) |
45.5% (2009) |
In December 2007, ICJ allocates San Andres, Providencia, and Santa Catalina islands to Colombia under 1928 Treaty but does not rule on 82 degrees W meridian as maritime boundary with Nicaragua; managed dispute with Venezuela over maritime boundary and Venezuelan-administered Los Monjes Islands near the Gulf of Venezuela; Colombian-organized illegal narcotics, guerrilla, and paramilitary activities penetrate all neighboring borders and have caused Colombian citizens to flee mostly into neighboring countries; Colombia, Honduras, Nicaragua, Jamaica, and the US assert various claims to Bajo Nuevo and Serranilla Bank. |
| Ecuador | 14,483,499 | $8,300 (2011 est.) |
33.1% (June 2010) |
Organized illegal narcotics operations in Colombia penetrate across Ecuador's shared border, which thousands of Colombians also cross to escape the violence in their home country. |
| El Salvador | 6,227,000 | $7,600 (2011 est.) |
37.8% (2009 est.) |
International Court of Justice (ICJ) ruled on the delimitation of "bolsones" (disputed areas) along the El Salvador-Honduras boundary, in 1992, with final agreement by the parties in 2006 after an Organization of American States (OAS) survey and a further ICJ ruling in 2003; the 1992 ICJ ruling advised a tripartite resolution to a maritime boundary in the Gulf of Fonseca advocating Honduran access to the Pacific; El Salvador continues to claim tiny Conejo Island, not identified in the ICJ decision, off Honduras in the Gulf of Fonseca. |
| Guyana | 784,894 | $7,500 (2011 est.) |
11% (2007) |
All of the area west of the Essequibo River is claimed by Venezuela preventing any discussion of a maritime boundary; Guyana has expressed its intention to join Barbados in asserting claims before UNCLOS that Trinidad and Tobago's maritime boundary with Venezuela extends into their waters; Suriname claims a triangle of land between the New and Kutari/Koetari rivers in a historic dispute over the headwaters of the Courantyne; Guyana seeks arbitration under provisions of the UN Convention on the Law of the Sea (UNCLOS) to resolve the long-standing dispute with Suriname over the axis of the territorial sea boundary in potentially oil-rich waters. |
| Honduras | 8,215,313 | $4,300 (2011 est.) |
65% (2010) |
International Court of Justice (ICJ) ruled on the delimitation of "bolsones" (disputed areas) along the El Salvador-Honduras border in 1992 with final settlement by the parties in 2006 after an Organization of American States (OAS) survey and a further ICJ ruling in 2003; the 1992 ICJ ruling advised a tripartite resolution to a maritime boundary in the Gulf of Fonseca with consideration of Honduran access to the Pacific; El Salvador continues to claim tiny Conejo Island, not mentioned in the ICJ ruling, off Honduras in the Gulf of Fonseca; Honduras claims the Belizean-administered Sapodilla Cays off the coast of Belize in its constitution, but agreed to a joint ecological park around the cays should Guatemala consent to a maritime corridor in the Caribbean under the OAS-sponsored 2002 Belize-Guatemala Differendum; memorials and countermemorials were filed by the parties in Nicaragua's 1999 and 2001 proceedings against Honduras and Colombia at the ICJ over the maritime boundary and territorial claims in the western Caribbean Sea - final public hearings are scheduled for 2007. |
| Panama | 3,405,813 | $13,600 (2011 est.) |
25.6% (2010 est.) |
Organized illegal narcotics operations in Colombia operate within the remote border region with Panama. |
| Paraguay | 6,337,127 | $5,500 (2011 est.) |
18.8% (2009 est.) |
Unruly region at convergence of Argentina-Brazil-Paraguay borders is locus of money laundering, smuggling, arms and illegal narcotics trafficking, and fundraising for extremist organizations. |
| Peru | 29,797,694 | $10,000 (2011 est.) |
34.8% (2009) |
Chile and Ecuador rejected Peru's November 2005 unilateral legislation to shift the axis of their joint treaty-defined maritime boundaries along the parallels of latitude to equidistance lines which favor Peru; organized illegal narcotics operations in Colombia have penetrated Peru's shared border; Peru rejects Bolivia's claim to restore maritime access through a sovereign corridor through Chile along the Peruvian border. |
| Suriname | 529,000 | $9,500 (2011 est.) |
70% (2002 est.) |
Area claimed by French Guiana between Riviere Litani and Riviere Marouini (both headwaters of the Lawa); Suriname claims a triangle of land between the New and Kutari/Koetari rivers in a historic dispute over the headwaters of the Courantyne; Guyana seeks United Nations Convention on the Law of the Sea (UNCLOS) arbitration to resolve the long-standing dispute with Suriname over the axis of the territorial sea boundary in potentially oil-rich waters. |
I am going to hypothesize that GDP per capita and the percentage of the population below the poverty line are correlated. It does not look to be completely linear from the numbers, but I'd like to see a graph.
Here is a crude plot of Annual GDP per capita (thousands of dollars) vs. Percent of the population in poverty at less than $2/day.
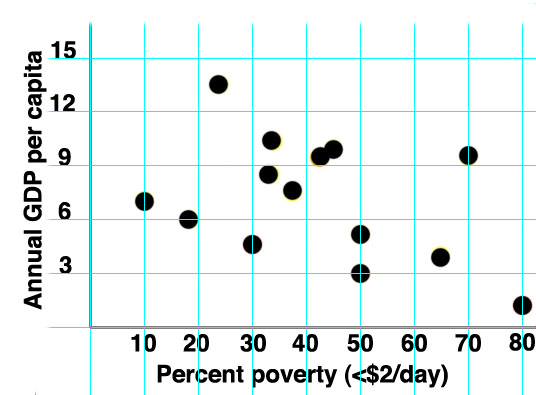 |
| Annual GDP per capita vs. percent of the population in poverty. Data from table above. |
This is a pretty fuzzy plot. An income of $2/day is $730/year. If income were equally distributed and there was no overhead (that is, government), there would be no poverty even in Haiti ($1,200 annual GDP per capita).
If we drew a line from the data point for Haiti at the lower right straight through the middle of the swarm of points, it looks like it would hit the Y-axis at annual GDP per capita at about $15,000. This is a crude guess about what the annual GDP per capita would have to be to eliminate extreme poverty.
For the sake of comparison, annual US GDP per capita was about $47,000 in 2010 with a poverty rate of 14.3%. This is not strictly comparable because the US poverty threshold was $21,954 in 2009, about $60/day.
Let's see if there is any more information on the weak correlation between per annual GDP per capita and the poverty rate. The World Factbook from the website of the Central Intelligence Agency gives a summary of the economic situation in each country.
Here is the list of countries with economic data from before, with the new summary added.
| Country | GDP Per Capita | Population Below Poverty Line ($2/day) |
Economy |
| Bolivia | $4,800 (2011 est.) |
30.3% | Bolivia is one of the poorest and least developed countries in Latin America. Following a disastrous economic crisis during the early 1980s, reforms spurred private investment, stimulated economic growth, and cut poverty rates in the 1990s. The period 2003-05 was characterized by political instability, racial tensions, and violent protests against plans - subsequently abandoned - to export Bolivia's newly discovered natural gas reserves to large northern hemisphere markets. In 2005, the government passed a controversial hydrocarbons law that imposed significantly higher royalties and required foreign firms then operating under risk-sharing contracts to surrender all production to the state energy company in exchange for a predetermined service fee. The global recession slowed growth, but Bolivia recorded the highest growth rate in South America during 2009. During 2010-11 increases in world commodity prices resulted in large trade surpluses. However, a lack of foreign investment in the key sectors of mining and hydrocarbons and higher food prices pose challenges for the Bolivian economy. |
| Haiti | $1,200 (2011 est.) |
80% (2003 est.) |
Haiti is a free market economy that enjoys the advantages of low labor costs and tariff-free access to the US for many of its exports. Poverty, corruption, and poor access to education for much of the population are among Haiti's most serious disadvantages. Over the longer term, Haiti needs to create jobs for its young workforce and to build institutional capacity. Haiti's economy suffered a severe setback when a 7.0 magnitude earthquake destroyed much of its capital city, Port-au-Prince, and neighboring areas in January 2010. Already the poorest country in the Western Hemisphere with 80% of the population living under the poverty line and 54% in abject poverty, the damage to Port-au-Prince caused the country's GDP to contract an estimated 5.1% in 2010. Two-thirds of all Haitians depend on the agricultural sector, mainly small-scale subsistence farming, and remain vulnerable to damage from frequent natural disasters, exacerbated by the country's widespread deforestation. US economic engagement under the Haitian Hemispheric Opportunity through Partnership Encouragement (HOPE) Act, passed in December 2006, has boosted apparel exports and investment by providing duty-free access to the US. Congress voted in 2010 to extend the legislation until 2020 under the Haitian Economic Lift Act (HELP); the apparel sector accounts for three-quarters of Haitian exports and nearly one-tenth of GDP. Remittances are the primary source of foreign exchange, equaling nearly 20% of GDP and more than twice the earnings from exports. Haiti suffers from a lack of investment, partly because of limited infrastructure and a lack of security. In 2005, Haiti paid its arrears to the World Bank, paving the way for reengagement with the Bank. Haiti received debt forgiveness for over $1 billion through the Highly-Indebted Poor Country (HIPC) initiative in mis-2009. The remainder of its outstanding external debt was cancelled by donor countries in early 2010 but has since risen to about $400 million. The government relies on formal international economic assistance for fiscal sustainability, with over half of its annual budget coming from outside sources. |
| Dominican Republic | $9,300 (2011 est.) |
42.2% (2004) |
The Dominican Republic has long been viewed primarily as an exporter of sugar, coffee, and tobacco, but in recent years the service sector has overtaken agriculture as the economy's largest employer, due to growth in telecommunications, tourism, and free trade zones. The economy is highly dependent upon the US, the destination for nearly 60% of exports. Remittances from the US amount to about a tenth of GDP, equivalent to almost half of exports and three-quarters of tourism receipts. The country suffers from marked income inequality; the poorest half of the population receives less than one-fifth of GDP, while the richest 10% enjoys nearly 40% of GDP. High unemployment and underemployment remains an important long-term challenge. The Central America-Dominican Republic Free Trade Agreement (CAFTA-DR) came into force in March 2007, boosting investment and exports and reducing losses to the Asian garment industry. The growth of the Dominican Republic's economy rebounded in 2010-11 from the global recession, and remains one of the fastest growing in the region. |
| Guatemala | $5,000 (2011 est.) |
51% (2006 est.) |
Guatemala is the most populous country in Central America with a GDP per capita roughly one-half that of the average for Latin America and the Caribbean. The agricultural sector accounts for nearly 15% of GDP and half of the labor force; key agricultural exports include coffee, sugar, and bananas. The 1996 peace accords, which ended 36 years of civil war, removed a major obstacle to foreign investment, and since then Guatemala has pursued important reforms and macroeconomic stabilization. The Dominican Republic-Central American Free Trade Agreement (CAFTA-DR) entered into force in July 2006 spurring increased investment and diversification of exports, with the largest increases in ethanol and non-traditional agricultural exports. While CAFTA-DR has helped improve the investment climate, concerns over security, the lack of skilled workers and poor infrastructure continue to hamper foreign direct investment. The distribution of income remains highly unequal with the richest 10% of the population accounting for more than 40% of Guatemala's overall consumption. More than half of the population is below the national poverty line and 15% lives in extreme poverty. Poverty among indigenous groups, which make up 38% of the population, averages 76% and extreme poverty rises to 28%. 43% of children under five are chronically malnourished, one of the highest malnutrition rates in the world. Given Guatemala's large expatriate community in the United States, it is the top remittance recipient in Central America, with inflows serving as a primary source of foreign income equivalent to nearly two-thirds of exports or one-tenth of GDP. Economic growth fell in 2009 as export demand from US and other Central American markets dropped and foreign investment slowed amid the global recession, but the economy recovered gradually in 2010-11 and will likely return to more normal growth rates in 2012. |
| Nicaragua | $3,200 (2011 est.) |
48% (2005) |
Nicaragua, the poorest country in Central America and the second poorest in the Hemisphere, has widespread underemployment and poverty. The US-Central America Free Trade Agreement (CAFTA) has been in effect since April 2006 and has expanded export opportunities for many agricultural and manufactured goods. Textiles and apparel account for nearly 60% of Nicaragua's exports, but increases in the minimum wage during the ORTEGA administration will likely erode its comparative advantage in this industry. ORTEGA's promotion of mixed business initiatives, owned by the Nicaraguan and Venezuelan state oil firms, together with the weak rule of law, could undermine the investment climate for domestic and international private firms in the near-term. Nicaragua relies on international economic assistance to meet internal- and external-debt financing obligations. Foreign donors have curtailed this funding, however, in response to November 2008 electoral fraud. In early 2004, Nicaragua secured some $4.5 billion in foreign debt reduction under the Heavily Indebted Poor Countries (HIPC) initiative. Managua still struggles with a high public debt burden, however, it succeeded in reducing that burden substantially in 2011. The economy grew at a rate of about 4% in 2011. |
| Brazil | $11,600 (2011 est.) |
26% (2008) |
Characterized by large and well-developed agricultural, mining, manufacturing, and service sectors, Brazil's economy outweighs that of all other South American countries, and Brazil is expanding its presence in world markets. Since 2003, Brazil has steadily improved its macroeconomic stability, building up foreign reserves, and reducing its debt profile by shifting its debt burden toward real denominated and domestically held instruments. In 2008, Brazil became a net external creditor and two ratings agencies awarded investment grade status to its debt. After record growth in 2007 and 2008, the onset of the global financial crisis hit Brazil in September 2008. Brazil experienced two quarters of recession, as global demand for Brazil's commodity-based exports dwindled and external credit dried up. However, Brazil was one of the first emerging markets to begin a recovery. In 2010 consumer and investor confidence revived and GDP growth reached 7.5%, the highest growth rate in the past 25 years. Brazil has since then experienced an economic slowdown, driven primarily by a faltering industrial sector and Brazil's fast-rising currency. Brazil's high interest rates make it an attractive destination for foreign investors. Large capital inflows over the past several years have contributed to the rapid appreciation of its currency and led the government to raise taxes on some foreign investments. President Dilma ROUSSEFF has pledged to retain the previous administration's commitment to inflation targeting by the central bank, a floating exchange rate, and fiscal restraint. |
| Colombia | $10,100 (2011 est.) |
45.5% (2009) |
Colombia's consistently sound economic policies and aggressive promotion of free trade agreements in recent years have bolstered its ability to face external shocks. Real GDP is projected to grow by between 5-6% and inflation to end 2011 at less than 4% continuing almost a decade of strong economic performance. All three major ratings agencies have upgraded Colombia's investment grade. Nevertheless, Colombia depends heavily on oil exports, making it vulnerable to a drop in oil prices. Economic development is stymied by inadequate infrastructure, weakened further by recent flooding. Moreover, the 9.2% official unemployment rate is still one of Latin America's highest. The SANTOS Administration's foreign policy has focused on bolstering Colombia's commercial ties and boosting investment at home. The U.S.-Colombia Free Trade Agreement (FTA) was ratified by the US Congfess in October 2011 and is expected to be implemented in mid-2012. Columbia has signed or is negotiating FTAs with a number of other countries, including Canada, Mexico, Switzerland, the EU, Venezuela, South Korea, Turkey, Japan, and Israel. Foreign direct investment - notably in the oil sector - reached a record $10 billion in 2008, but dropped to $7.2 billion in 2009, before beginning to recover in 2010, and it appears to have reached a record high $13 billion in 2011. Colombia is the third largest Latin American exporter of oil to the US. Inequality, underemployment, and narcotrafficking remain significant challenges, and Colombia's infrastructure requires major improvements to sustain economic expansion. In late 2010, Colombia experienced its most severe flooding in decades, with damages estimated to exceed $6 billion. The rains resumed in 2011, causing further damages to crops and infrastructure, as well as killing hundreds of Colombians and displacing millions. |
| Ecuador | $8,300 (2011 est.) |
33.1% (June 2010) |
Ecuador is substantially dependent on its petroleum resources, which have accounted for more than half of the country's export earnings and approximately one-third of public sector revenues in recent years. In 1999/2000, Ecuador suffered a severe economic crisis, with GDP contracting by 5.3%. Poverty increased significantly, the banking system collapsed, and Ecuador defaulted on its external debt. In March 2000, the Congress approved a series of structural reforms that also provided for the adoption of the US dollar as legal tender. Dollarization stabilized the economy, and positive growth returned in the years that followed, helped by high oil prices, remittances, and increased non-traditional exports. From 2002-06 the economy grew an average of 5.2% per year, the highest five-year average in 25 years. After moderate growth in 2007, the economy reached a growth rate of 7.2% in 2008, in large part due to high global petroleum prices and increased public sector investment. President Rafael CORREA, who took office in January 2007, defaulted in December 2008 on Ecuador's sovereign debt, which, with a total face value of approximately US$3.2 billion, represented about 80% of Ecuador's private external debt. In May 2009, Ecuador bought back 91% of its "defaulted" bonds via an international auction. Economic policies under the CORREA administration - including an announcement in late 2009 of its intention to terminate 13 bilateral investment treaties, including one with the United States - have generated economic uncertainty and discouraged private investment. The Ecuadorian economy slowed to 0.4% growth in 2009 due to the global financial crisis and to the sharp decline in world oil prices and remittance flows. Growth picked up to a 3.6% rate in 2010 and 5.8% in 2011. The government in 2011 signed a $2 billion loan with the state-owned China Development Bank and announced plans to obtain further Chinese loans. China has become Ecuador's largest foreign lender since Quito defaulted in 2008, allowing the government to maintain a high rate of social spending. |
| El Salvador | $7,600 (2011 est.) |
37.8% (2009 est.) |
Despite being the smallest country geographically in Central America, El Salvador has the third largest economy in the region. The economy took a hit from the global recession and real GDP contracted by 3.5% in 2009. The economy began a slow recovery in 2010 on the back of improved export and remittances figures. Remittances accounted for 17% of GDP in 2011, and about a third of all households receive these transfers. In 2006 El Salvador was the first country to ratify the Dominican Republic-Central American Free Trade Agreement (CAFTA-DR), which has bolstered the export of processed foods, sugar, and ethanol, and supported investment in the apparel sector amid increased Asian competition and the expiration of the Multi-Fiber Agreement in 2005. El Salvador has promoted an open trade and investment environment, and has embarked on a wave of privatizations extending to telecom, electricity distribution, banking, and pension funds. In late 2006, the government and the Millennium Challenge Corporation signed a five-year, $461 million compact to stimulate economic growth and reduce poverty in the country's northern region, the primary conflict zone during the civil war, through investments in education, public services, enterprise development, and transportation infrastructure. In 2011 the MCC granted El Salvador permission submit a second proposal for MCC funding. With the adoption of the US dollar as its currency in 2001, El Salvador lost control over monetary policy. Any counter-cyclical policy response to the downturn must be through fiscal policy, which is constrained by legislative requirements for a two-thirds majority to approve any international financing, and by already high levels of debt. |
| Guyana | $7,500 (2011 est.) |
11% (2007) |
The Guyanese economy exhibited moderate economic growth in recent years and is based largely on agriculture and extractive industries. The economy is heavily dependent upon the export of six commodities - sugar, gold, bauxite, shrimp, timber, and rice - which represent nearly 60% of the country's GDP and are highly susceptible to adverse weather conditions and fluctuations in commodity prices. Guyana's entrance into the Caricom Single Market and Economy (CSME) in January 2006 has broadened the country's export market, primarily in the raw materials sector. Economic recovery since a 2005 flood-related contraction was buoyed by increases in remittances and foreign direct investment in the sugar and rice industries as well as the mining sector. Chronic problems include a shortage of skilled labor and a deficient infrastructure. The government is juggling a sizable external debt against the urgent need for expanded public investment. In March 2007, the Inter-American Development Bank, Guyana's principal donor, canceled Guyana's nearly $470 million debt, equivalent to nearly 48% of GDP, which along with other Highly Indebted Poor Country (HIPC) debt forgiveness brought the debt-to-GDP ratio down from 183% in 2006 to 120% in 2007. Guyana became heavily indebted as a result of the inward-looking, state-led development model pursued in the 1970s and 1980s. Growth slowed in 2009 as a result of the world recession, but picked up in 2010-11. The slowdown in the domestic economy and lower import costs helped to narrow the country's current account deficit, despite generally lower earnings from exports. |
| Honduras | $4,300 (2011 est.) |
65% (2010) |
Honduras, the second poorest country in Central America, suffers from extraordinarily unequal distribution of income, as well as high underemployment. While historically dependent on the export of bananas and coffee, Honduras has diversified its export base to include apparel and automobile wire harnessing. Nearly half of Honduras's economic activity is directly tied to the US, with exports to the US accounting for 30% of GDP and remittances for another 20%. The US-Central America Free Trade Agreement (CAFTA) came into force in 2006 and has helped foster foreign direct investment, but physical and political insecurity, as well as crime and perceptions of corruption, may deter potential investors; about 70% of FDI is from US firms. The economy registered sluggish economic growth in 2010, insufficient to improve living standards for the nearly 60% of the population in poverty. The LOBO administration inherited a difficult fiscal position with off-budget debts accrued in previous administrations and government salaries nearly equivalent to tax collections. His government has displayed a commitment to improving tax collection and cutting expenditures, and attracting foreign investment. This enabled Tegucigalpa to secure an IMF Precautionary Stand-By agreement in October 2010. The IMF agreement has helped renew multilateral and bilateral donor confidence in Honduras following the ZELAYA administration's economic mismanagement and the 2009 coup. |
| Panama | $13,600 (2011 est.) |
25.6% (2010 est.) |
Panama's dollar-based economy rests primarily on a well-developed services sector that accounts for three-quarters of GDP. Services include operating the Panama Canal, logistics, banking, the Colon Free Zone, insurance, container ports, flagship registry, and tourism. Economic growth will be bolstered by the Panama Canal expansion project that began in 2007 and is scheduled to be completed by 2014 at a cost of $5.3 billion - about 10% of current GDP. The expansion project will more than double the Canal's capacity, enabling it to accommodate ships that are too large to traverse the existing canal. The United States and China are the top users of the Canal. Panama also plans to construct a metro system in Panama City, valued at $1.2 billion and scheduled to be completed by 2014. Panama's booming transportation and logistics services sectors, along with aggressive infrastructure development projects, have lead the economy to continued growth in 2011. Strong economic performance has not translated into broadly shared prosperity, as Panama has the second worst income distribution in Latin America. About 30% of the population lives in poverty; however, from 2006 to 2010 poverty was reduced by 10 percentage points, while unemployment dropped from 12% to less than 3% of the labor force in 2011. A US-Panama Trade Promotion Agreement was approved by Congress and signed into law in October 2011. Seeking removal from the Organization of Economic Development's gray-list of tax havens, Panama has also recently signed various double taxation treaties with other nations. |
| Paraguay | $5,500 (2011 est.) |
18.8% (2009 est.) |
Landlocked Paraguay has a market economy distinguished by a large informal sector, featuring re-export of imported consumer goods to neighboring countries, as well as the activities of thousands of microenterprises and urban street vendors. A large percentage of the population, especially in rural areas, derives its living from agricultural activity, often on a subsistence basis. Because of the importance of the informal sector, accurate economic measures are difficult to obtain. On a per capita basis, real income has stagnated at 1980 levels. The economy grew rapidly between 2003 and 2008 as growing world demand for commodities combined with high prices and favorable weather to support Paraguay's commodity-based export expansion. Paraguay is the sixth largest soy producer in the world. Drought hit in 2008, reducing agricultural exports and slowing the economy even before the onset of the global recession. The economy fell 3.8% in 2009, as lower world demand and commodity prices caused exports to contract. The government reacted by introducing fiscal and monetary stimulus packages. Growth resumed at a 15% level in 2010, the highest in South America, but slowed to about 6% in 2011 as the stimulus subsided. Political uncertainty, corruption, limited progress on structural reform, and deficient infrastructure are the main obstacles to growth. |
| Peru | $10,000 (2011 est.) |
34.8% (2009) |
Peru's economy reflects its varied geography - an arid coastal region, the Andes further inland, and tropical lands bordering Colombia and Brazil. Abundant mineral resources are found in the mountainous areas, and Peru's coastal waters provide excellent fishing grounds. The Peruvian economy has been growing by an average of 6% per year since 2011 with a stable exchange rate and low inflation. Growth in 2010 was above 8% and in 2011 above 6%, due partly to a leap in private investment, especially in the extractive sector, which accounts for more than 60% of Peru's total exports. Inflation in 2011 was within the upper range of the Central Bank's 1%-3% target. Despite Peru's strong macroeconomic performance, dependence on minerals and metals exports and imported foodstuffs subjects the economy to fluctuations in world prices. Poor infrastructure hinders the spread of growth to Peru's non-coastal areas. Peru's rapid expansion coupled with cash transfers and other programs have helped to reduce the national poverty rate by over 19 percentage points since 2002. A growing number of Peruvians are sharing in the benefits of growth but inequality persists posing a challenge for the new Ollanta HUMALA administration, which has championed indigenous and local disenfranchised groups. The administration seems committed to Peru's free-trade path. Since 2006, Peru has signed trade deals with the United States, Canada, Singapore, China, Korea, and Japan, concluded negotiations with the European Free Trade Association (EFTA) and Chile, and begun trade talks with Central American countries and others. The US-Peru Trade Promotion Agreement (PTPA) entered into force 1 February 2009, opening the way to greater trade and investment between the two economies. Trade agreements with South Korea, Japan, and Mexico also were signed in 2011. Although Peru has continued to attract foreign investment, political disputes and protests against foreign investors may impede development of some projects related to natural resource extraction. |
| Suriname | $9,500 (2011 est.) |
70% (2002 est.) |
The economy is dominated by the mining industry, with exports of alumina, gold, and oil accounting for about 85% of exports and 25% of government revenues, making the economy highly vulnerable to mineral price volatility. In 2000, the government of Ronald VENETIAAN, returned to office and inherited an economy with inflation of over 100% and a growing fiscal deficit. He quickly implemented an austerity program, raised taxes, attempted to control spending, and tamed inflation. Economic growth reached about 7% in 2008, owing to sizeable foreign investment in mining and oil. Suriname has received aid for projects in the bauxite and gold mining sectors from Netherlands, Belgium, and the European Development Fund. The economy slowed in 2009, however, as investment waned and the country earned less from its commodity exports when global prices for most commodities fell. Trade picked up, boosting Suriname's economic growth in 2010, but the government's budget remained strained, with increased social spending during the election. In January 2011, the government devalued the currency by 20% and raised taxes to reduce the budget deficit. Suriname's economic prospects for the medium term will depend on continued commitment to responsible monetary and fiscal policies and to the introduction of structural reforms to liberalize markets and promote competition. |
This collection of summaries illustrates the complex interplay between politics, trade agreements, international investment, and natural resources that determines the situation in each country. These summaries serve to inform us about the extent to which various plans for crop improvement and the promotion of agriculture would address poverty and hunger in each country.
It's time to think about food. Some possible solutions might include providing improved crops to subsistence farmers. I wanted to examine the extent of subsistence farming in South America.
I found a good article on the web, Multifunctional Dimensions of Ecologically-based Agriculture in Latin America by Miguel A. Altieri, Department of Environmental Science Policy and Management, University of California, Berkeley.
This is a really informative article that shows how traditional farming of small plots without mechanization can lead to improved outcomes. The article discusses how specific types of intercropping (mixed planting) have lead to improved yields and decreased pest susceptibility. Clearly, there is much to be learned from traditional agriculture.
Here are some publications available online cited in the article above:
This raises the question of what types of innovations are likely to have an impact. This can be a subject for class discussion. I can think of the following:
We have introduced Polya's (How to Solve It) method for solving problems. Let's review how we have applied the method here:
Understanding the Problem. We have collected additional data on the dimensions of the problem of hunger in each of the affected countries.
Devising a Plan. We planned to gather and examine data about the economy and poverty in each of the affected countries. We planned to gather data about small-scale agriculture in each of the affected countries.
Carrying Out the Plan. We have only just begun to consider the implications of the data. It is clear that the problem of hunger results from a complex interplay of economic, political, cultural, and environmental factors. It appears that changes in small-scale agricultural practices might have a substantial positive impact.
Looking Back. We will present this approach to class for additional thinking.
We need more information on: